Some ascii tables & selection functions used in the paper
- correlation ratio of matter to linear density field at z=0 (download)
- correlation ratio of matter to linear density field at z=0.5 (download )
- correlation ratio of matter to linear density field at z=2.6 (download )
- correlation ratio of LRG to linear density field at z=0 (download )
- correlation ratio of LRG to linear density field at z=0.5 (download )
- correlation ratio of LRG to simulated matter density field at z=0 (download )
- correlation ratio of LRG to simulated matter density field at z=0.5 (download )
Mean radial selection function (download)
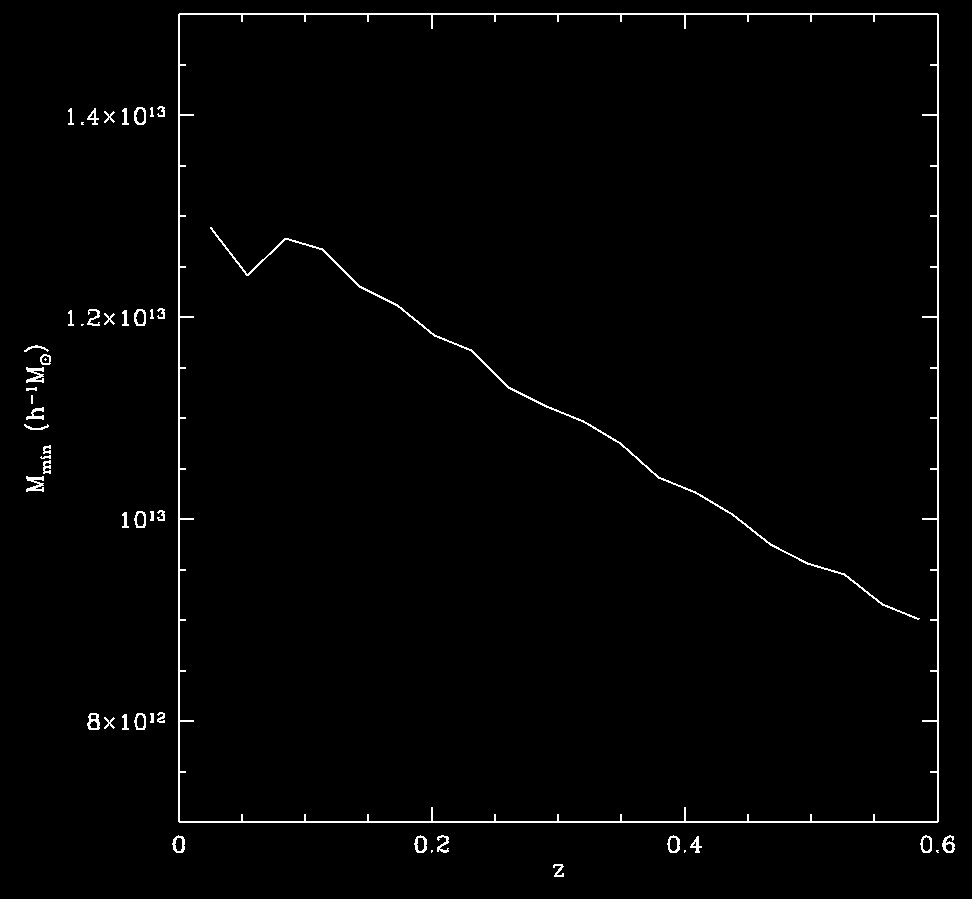
The above image shows the mean radial selection function applied to generate the eight mock LRG samples in the lightcone space. This radial selection function is calculated to produce the constant number density same as the expectation of the BOSS survey. The fluctuation in the inner region is mainly due to the small survey volume. Click here to enlarge the figure.
Matter power spectrum
This linked file has a supermongo plotting script to show the matter power
spectrum for the HR1.
Download it and un-tar to get several data and one supermongo script files.
One can plot the power spectrum as
supermongo> inp pk.sm
Please refer to pk.sm to get information on the redshift and analytic power spectral files.